THE INFORMATION IN THIS ARTICLE APPLIES TO:
DISCUSSION
In software development, instrumentation refers to the measure of a product's performance, to diagnose errors, and to write trace information. When an application contains instrumentation code, it can be viewed using a management tool. This knowledgebase article describes how to instrument your Advanced Workflow code to measure its performance.
Sometimes it is necessary to measure the performance of sub-sections of an advanced workflow, either to baseline a complex workflow’s performance at key steps, or to benchmark a modified workflow’s steps against its baseline values, or to troubleshoot poorly performing workflows when trying to identify which steps are causing the performance slowdown.
Out of the box, you can observe the Advanced Workflow logs or EFT’s ARM logs to see workflow start and stop times. With debug enabled for a given workflow, you can even see start times for a given step; however, these do not make it easy to measure elapsed time over a series of related steps or gauge the effects on the system while those steps were occurring.
The following approach can be used to audit a series of performance metrics to a log file, which you can later ingest and analyze in Excel. The solution is to sandwich the steps you want to measure between a Start and Stop Timer, while also using the Processes > Get Process Information action to record critical information such as memory utilization, user processor time, handle count, and more.
The output after multiple runs could look something like this:

Armed with this information, you can compare elapsed times and changes to memory over each successive run. You can even chart out a given set of records to visually analyze the data:
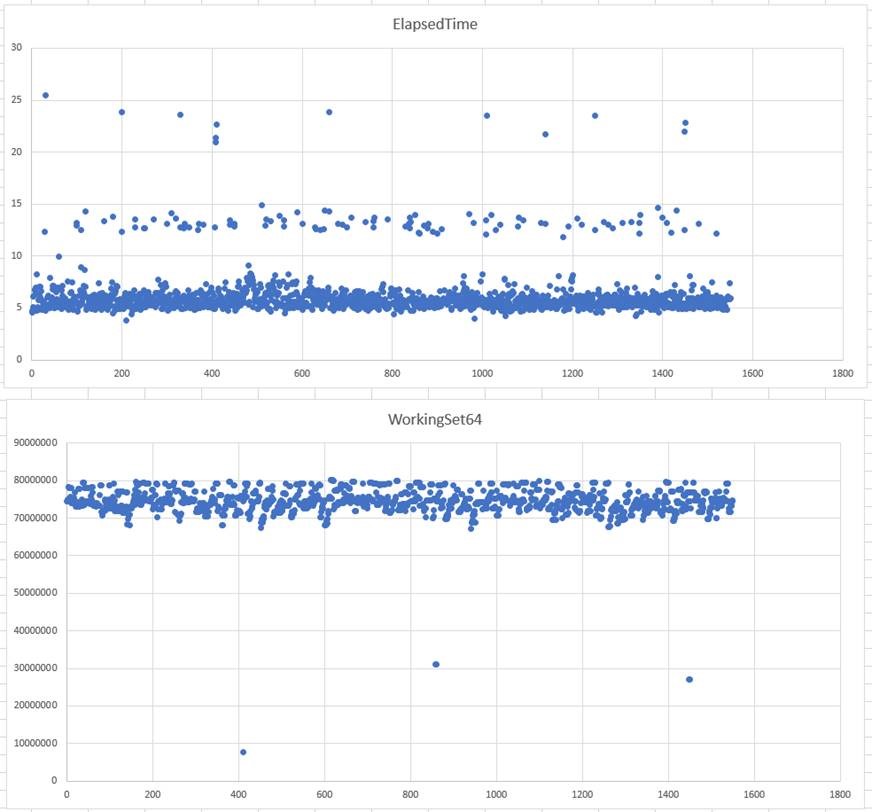
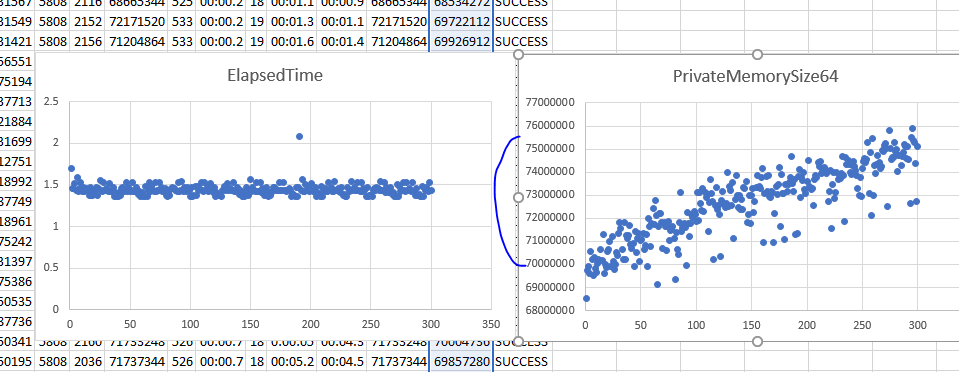
With data from multiple runs in hand, you can spot anomalous behavior or even potential problems, such as this memory leak (right chart below), which occurred after looping over a file and offloading it to a remote system over SFTP. Notice that the elapsed times are consistent, but if this loop had continued to run over a long period it still may have resulted in an out-of-memory error!
To instrument your code, find the section you want to measure, such as a set of operations that query a database or perform a series of critical functions. Then, set these variables right before that section or at the top of your code where you declare your variables (switch to AML mode and paste in the below):
<AMVARIABLE NAME="ElapsedTime" VALUE="0" />
<AMVARIABLE NAME="ThisMoment" VALUE="0" />
The others will be used for capturing different time factors: ThisMoment is the date and time which you will apply as a timestamp to each log entry. Elapsed time is the time in seconds it took to run the section of code you are concerned with measuring.
Next, right above the steps you want to measure, add the following:
<AMTIMER SESSION="TimerSession1" />
Then, add the following after the steps you want to measure:
<AMTIMER SESSION="TimerSession1" />
This step will retrieve the Process information for the “GSAWE” runtime and populate the results in a dataset (a special variable that holds an array of data, akin to a table). Note that you cannot run this task from within the task builder, as GSAWE will only execute when EFT runs the task from one if its event rules. Also note that if you are testing many parallel runs of a given workflow, you might have some difficulty distinguishing between AWE tasks in the output log, unless you add the PID value for that process.
<AMTIMER ACTIVITY="stop" RESULTVARIABLE="ElapsedTime" SESSION="TimerSession1" />
Now add a time formatter, so that ThisMoment is formatted to your liking:
<AMTEXT ACTIVITY="format_datetime" RESULTVARIABLE="ThisMoment" DATETIMEFORMAT="h:mm:ss" />
As the final step, you will want to write the captured information to a log file. Here I’ve selected to write a file to my C drive, using a comma as the delimiter for each variable and dataset element that I desire (these present a subset of all those available to the Process dataset):PREVIEW
<AMFILESYSTEM ACTIVITY="write_file" FILE="c:\output.csvt">%ThisMoment%,%ElapsedTime%,%proccessinfo.id%,%proccessinfo.handle%,%proccessinfo.WorkingSet64%,%proccessinfo.HandleCount%,%proccessinfo.PrivilegedProcessorTime%,%proccessinfo.Threads_Count%,%proccessinfo.TotalProcessorTime%,%proccessinfo.UserProcessorTime%,%proccessinfo.WorkingSet64%,%proccessinfo.PrivateMemorySize64%</AMFILESYSTEM>
And that’s it. Now when EFT runs my workflow, the Output.csv file will be appended with a new row. You can open that file in Excel and analyze the results.
Sample.aml:
<AMVARIABLE
NAME="ElapsedTime" VALUE="0" />
<AMVARIABLE
NAME="ThisMoment" VALUE="0" />
<AMTIMER
SESSION="TimerSession1" />
<AMPROCESSES
PROCESSNAME="AMTB.exe" RESULTDATASET="proccessinfo" />
<!-- Action to be measured
--> -->
<AMWAIT
SCALAR="2" />
<!-- Action to be measured -->
<AMTIMER ACTIVITY="stop" RESULTVARIABLE="ElapsedTime" SESSION="TimerSession1" />
<AMTEXT ACTIVITY="format_datetime" RESULTVARIABLE="ThisMoment" DATETIMEFORMAT="h:mm:ss" />
<AMFILESYSTEM ACTIVITY="write_file" FILE="c:\output.csv">%ThisMoment%,%ElapsedTime%,%proccessinfo.id%,%proccessinfo.handle%,%proccessinfo.WorkingSet64%,%proccessinfo.HandleCount%,%proccessinfo.PrivilegedProcessorTime%,%proccessinfo.Threads_Count%,%proccessinfo.TotalProcessorTime%,%proccessinfo.UserProcessorTime%,%proccessinfo.WorkingSet64%,%proccessinfo.PrivateMemorySize64%</AMFILESYSTEM>
Caveats
Performance measurements should always be taken in a non-production system in a well-controlled environment, to eliminate variances introduced by constantly shifting dependent variables you would typically experience in a chaotic production system.
Furthermore, even if running in an isolated test environment, careful attention should be paid to any differences introduced to independent variables between test runs. For example, if you are testing SFTP performance between two versions of the product, but one version defaults to using a different symmetric key cipher, then you have now modified two independent variables, and more than likely have invalidated any conclusions reached by observing the dependent variables after each test run.